Understanding Your Data
Taking the time to understand your data thoroughly is arguably the most important part of any analysis. Sometimes sources of confusion can arise from the data itself, especially when it contradicts existing knowledge.
Example
In an observational study, we were looking at the effects of two surgical interventions (A, B). The surgical interventions were applied across multiple rooms (1, 2, 3, 4). Hospital facilities experts in charge of environmental controls assured us that the rooms were identical in their ability to manage the environment. One thing that was known to fluctuate was humidity, which was affected by the outdoor humidity. When outdoor humidity rose, environmental controls responded by decreasing the humidity to keep humidity levels below a certain point. However when outdoor humidity fell, the room controls did not add humidity. Thus humidity was known to fall when it was dry outside. We thus made the decision to collect room humidity data.
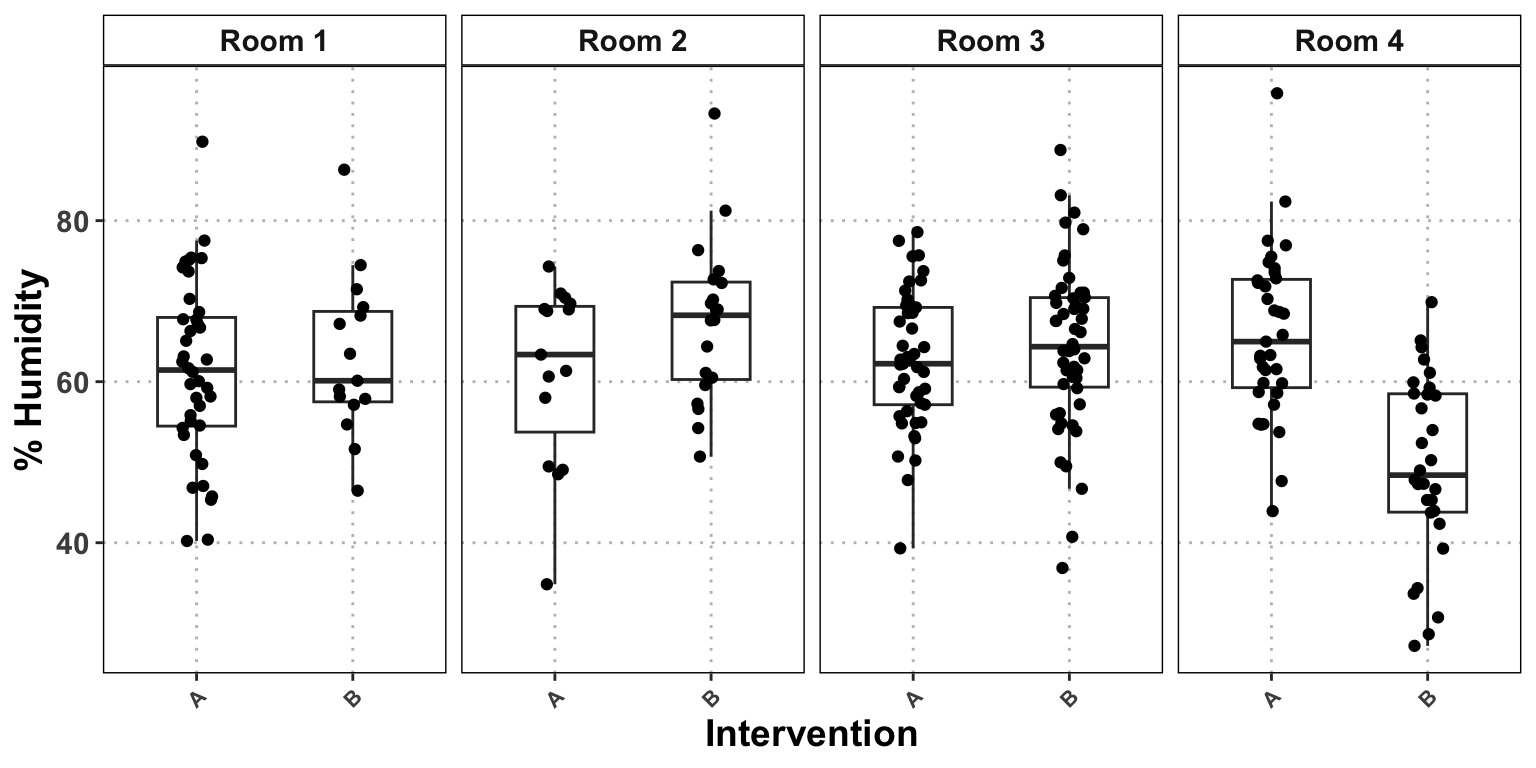
In our initial analysis, we noticed that % humidity in room 4, specifically for intervention B had lower humidities compared to intervention A in the same room and both interventions across the other rooms (see figure below). This was a cause for concern since if the rooms were identical, why was the humidity for one room for one intervention noticeably different from the others? Further, this could have been a signal that the rooms were, in fact, not identical. Our initial response was that there may be some kind of relationship or interaction between intervention B and room 4 that ultimately caused a drop in humidity. We prepared to account for this in our final model, potentially including room number as a covariate.
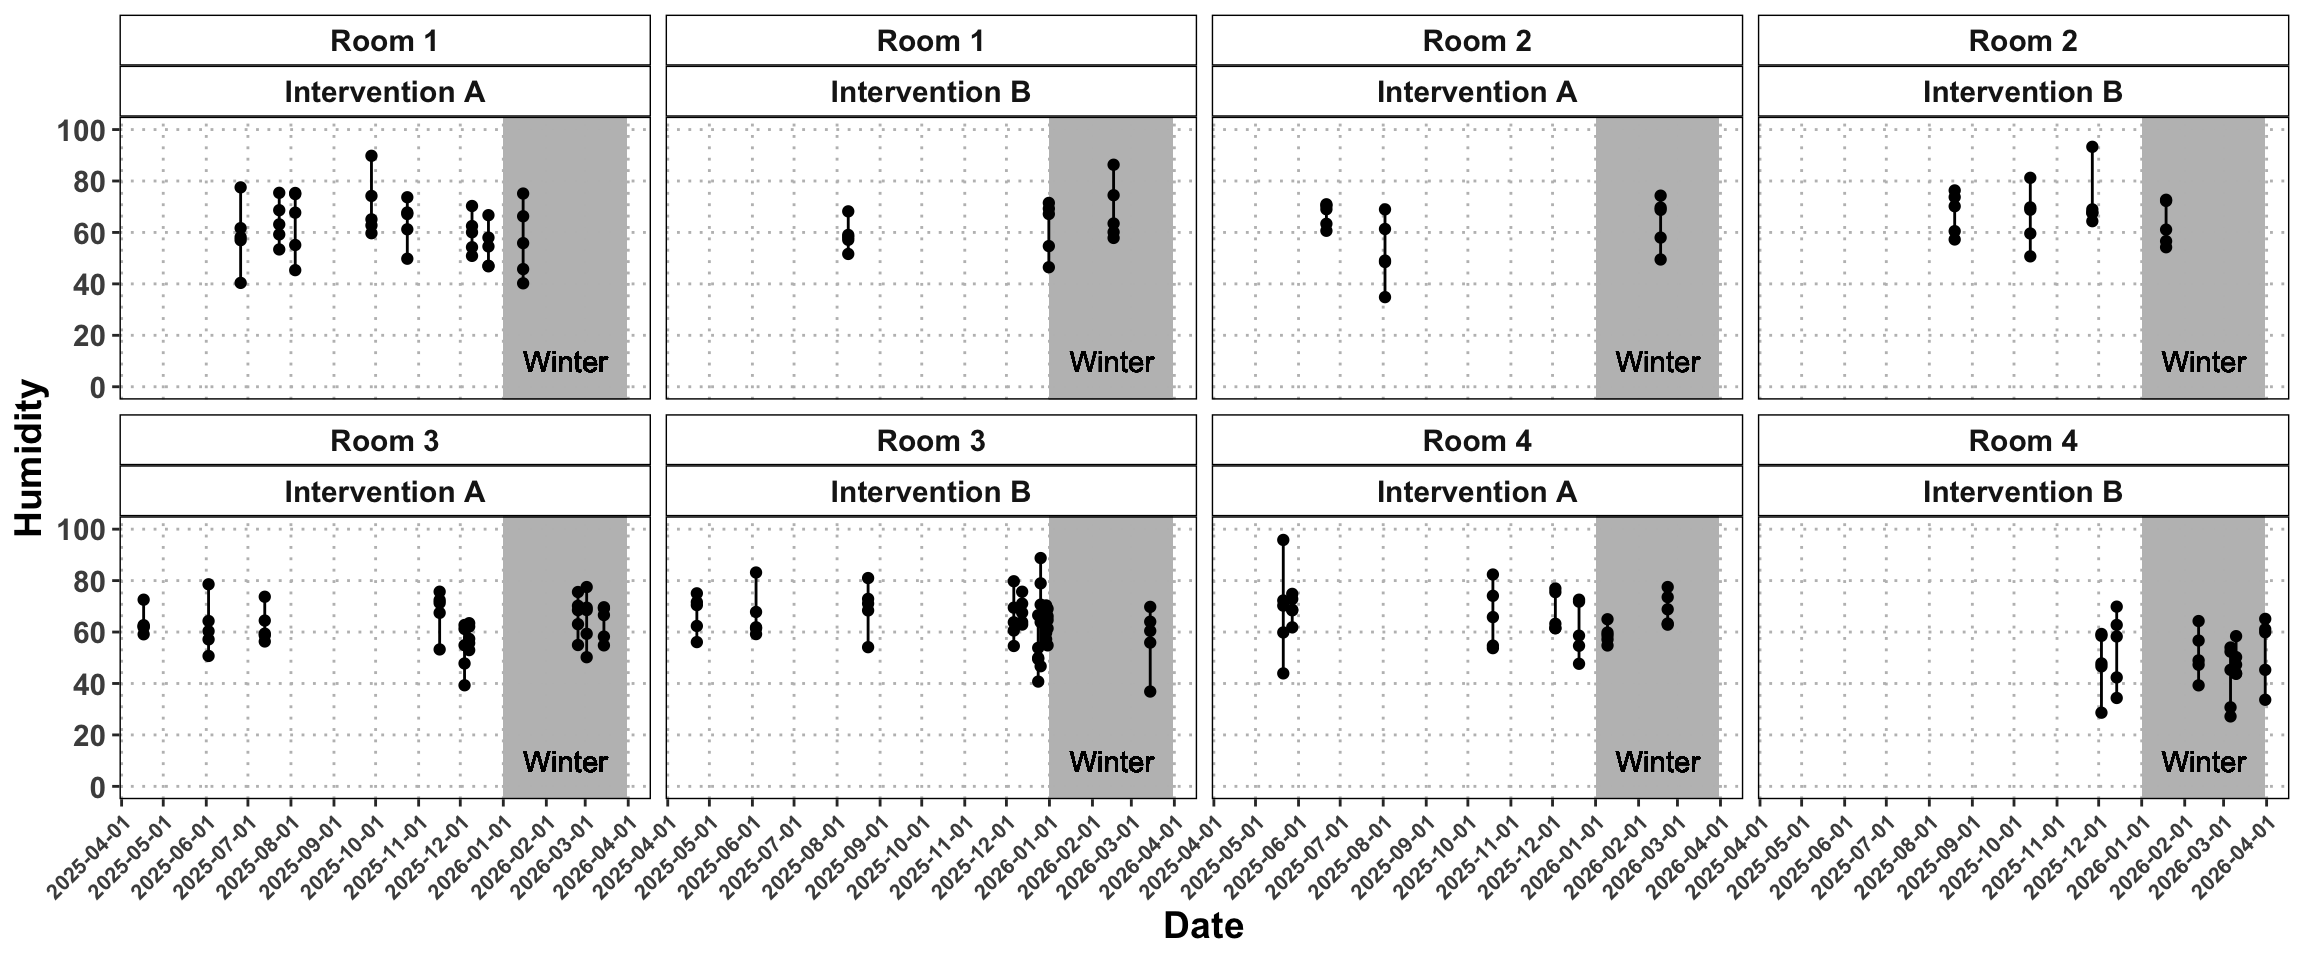
But as we took the time to understand our data, we noticed that the lower humidity for room 4 and intervention B was not due to an interaction. Instead, it was a result of the chronology or seasonality of patient enrolment. Due to the passive nature of our enrolment method, enrolments for patients receiving intervention B in room 4 happened to be concentrated between January through March 2026 (see figure below). In the geographical region of this study, these were the winter months where humidity tended to be at a minimum. This resolved the conflict between our facilities experts and the data and saved us from introducing covariates that, in reality, did not explain variation which would have reduced the power of the analysis.